| |
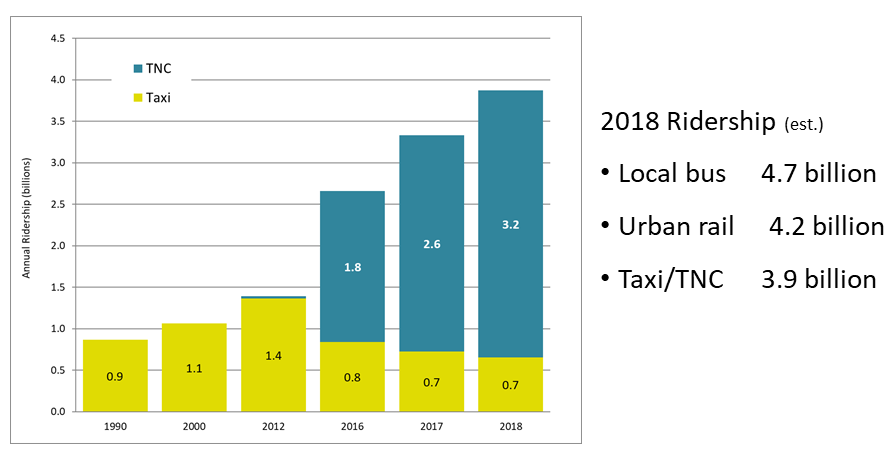
Ride Service and Taxi Ridership, 1990-2018
 Sources:
- Transportation Research Board, Between Public and Private Mobility: Examining the Rise of Technology-Enabled Transportation Services, TRB Special Report 319, December 2015 for taxi ridership 1990-2012.
- Estimated declines in taxi ridership since 2012 based on city-specific data where available and news reports.
- Lyft and Uber S-1 IPO statements and Lyft trips for 2017 and 2018 as reported by the company.
- Lyft and Uber market shares based on credit card transactions compiled by the research firm Second Measure.
- Conversion of trips to passengers is based on 1.5 passengers per trip, based on National Household Travel Survey data. The figure is for trips under 30 miles and is the same for both taxicabs and ride hail trips.
Vehicle miles traveled (VMT) for ride hail in 2018 is estimated at 18.1 billion miles, which includes 11.8 billion miles carrying passenger(s) and 6.3 billion miles between trips (e.g., "deadhead" miles from drop-off at the end of one trip to the next pick up).
VMT figures are based on:
- 6.1 miles per trip from National Household Travel Survey. (Duration average is 23 minutes and average speed is 16 mph.)
- 20% of trips involve shared ride (Note: where match is actually made and strangers ride together, not simply shared trip requests which Lyft reports as being 40% of trips.)
- 35% of mileage is between trips (deadhead miles), based on data from New York City, Chicago, San Francisco, Denver region and the State of California. See "New Automobility" report page 13.
|